Preamble - Performance Tuning
First off I would like to underline a key point. I’m not suggesting at the moment that I’m going to find out anything new or revolutionary. A lot of the initial steps I’ll be taking will undoubtedly be exactly the same as others have done before me. But I need to do it “one step at a time”, because that’s the way you learn using a pragmatic approach.
If you’re looking for “just” power graphs and peak figure talk….. whilst you’ll find that information here, this is really not what my project thread will be about - there is a lot more to modifications than just using these two elements as reference.
If I have one “mission” in life, that “mission” is to keep highlighting that on their own, peak figures mean diddly squat. If you just skim read this project, focussing on peak values and comparing those with other peak values (from others achievements), you are in my opinion, missing valuable context. Peak figures do not make for a quick car, and they certainly don’t tell you what you really need to appreciate. Peak figures are for the pub - and the next round won’t be on me!
You best get your empty plate ready, grab some salt and pepper, tuck your napkin in under your chin and prepare yourself for a mammoth “eat as much as you like” experience!!
I want to understand the detail of why and how, which will hopefully allow us all to understand how things could be improved and what is potentially looked at next in the journey.
First thing is to state is that Litchfield Motors will be the key company I’ll be working with at this stage. They have worked with me on three previous projects (two Subaru’s and my previous A45 AMG) since 2005, and they’ve always come up with the goods for me.
Performance measurement and tuning aids - Rolling Road Overview
Perhaps the single biggest bone of contention is how I would decide to measure/test for any increases (and of course decreases) in power, when looking at engine modifications. Several ways exist, namely use of a Rolling Road, Engine Dyno, Performance Meters and the regularly used “arse dyno”.
For the purpose of engine based modifications, stats will be attained by use of a Rolling Road, coupled with real driving feedback on the road.
Even though we may all agree that various rolling roads will give different readings, and the arguments that RR figures at X are incorrect and RR figures at Y are correct, is meaningless to a degree.
Although many conditions even on the same rolling road can cause changes in figures, we need something we can use to compare with accuracy and repeatability. Obviously the more conditions you can stabilise the more your figures will be representative.
Now, before I explain things further it’s probably worth me stating one thing here and now. I’m a self confessed “dyno queen”. At a guess, I suspect I have had well in excess of 500 runs on various dyno’s over the years (I wouldn’t actually be surprised if it’s closer to 1000 runs).
Even though I’m just a member of the Joe Soap gang, this number of runs on various dyno set-ups across the UK has provided me a vast amount of knowledge around this area. I’m sure we’ve all seen the arguments about which ones do or don’t over read. How important wheel horsepower is and how inaccurate flywheel horsepower is!?
Let’s get one thing straight…. a dyno is a tool, and if used correctly, a very valuable tool.
For the pub talk fanatics out there you know which type of dyno to go to, to receive inflated figures. If that makes you feel better, bully for you….. it’s your money and your ego. Personally, I place more emphasis on accuracy and repeatability.
Remember... there are lies, damn lies and dynos!
I could tell you heaps of ways that I could alter the way a car was run on a dyno, that would influence the figures obtained. Be rest assured that this is all about being “real” from my perspective. I have nothing to gain from presenting inflated figures, and it’s certainly not something I suspect you want to see.
If you are not already aware, power figures on Rolling Roads are normally part measured and part calculated. For the purpose of this project we will be showing flywheel BHP and torque figures. The core reason behind this is that here in the UK, that is our normal method of measurement. Some people will suggest that wheel horsepower figures are the be all and end all. I totally disagree in respect of chassis dynos. Like flywheel figures, wheel horsepower figures can also be up for a “slagging”. Different chassis dynos will undoubtedly produce different wheel horsepower figures. Why? Well it’s to do with the physical makeup of the dyno, like the rollers used and how all the “gubbins” works to “measure” the power. I could then start to talk about tyre deformation and the effect this has, but I suspect that will send you to sleep.
Some others will then take the stance that it matters not what figures the dyno produces, it’s the difference of the before and after in percentage terms. With people using those % differences as a defacto way of measuring performance. You have to be open minded about this as well, as you’re assuming conditions are like for like and that the power reported is based on linear measurements on a like for like basis, with the previous run. You can not guarantee that, especially when you’re using a dyno setup that you already know provides inaccurate data.
It makes absolute sense to start off with a dyno that you feel provides accuracy from the get go. It makes no sense to start off with a dyno that you already know provides inflated figures. This is assuming you want a level of accuracy in respect of figures attained….. although there are other key (and more important) reasons why a dyno provides a worthy advantage to tuning overall. This is something that will be explained further at appropriate points in this project.
Performance measurement and tuning aids - Which type of chassis dyno?
OK…. so I want to use a dyno that provides accurate (within context) flywheel figures and repeatable results. But what about the known issue of Haldex transmission and dynos?
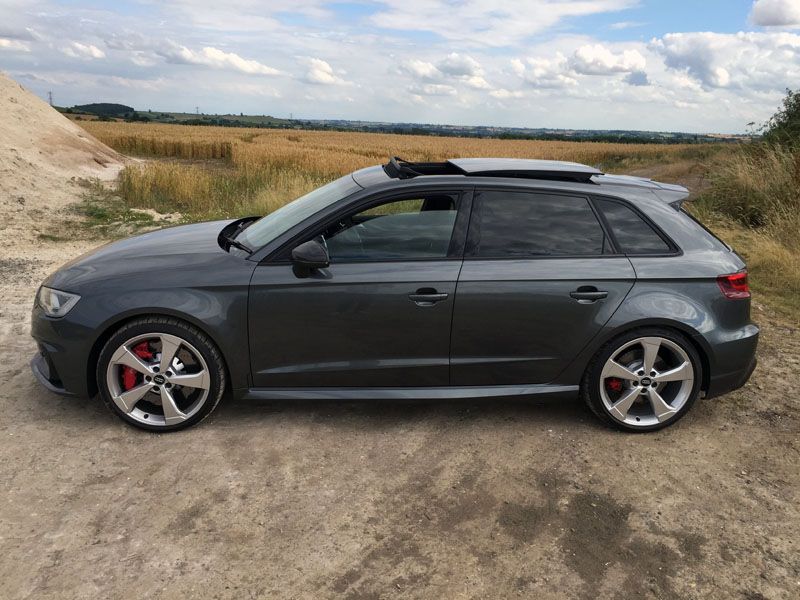
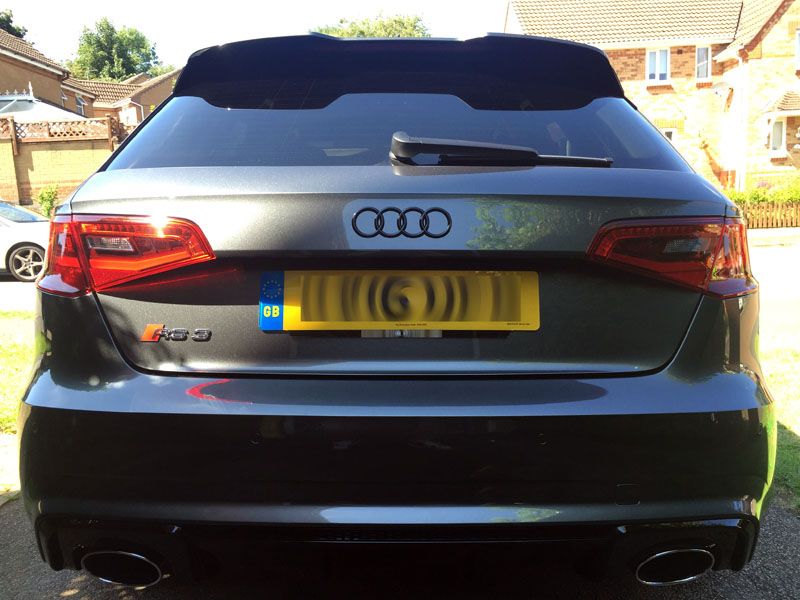
The RS3 uses a Haldex system to manage traction (torque balance) between the front and rear axles. Predominantly the system is front wheel, but has the capability to shift torque to the rear axle, when it detects slip at the front. So why is this a potential problem?
Since the Haldex system can and does switch to 4WD, you need to use a 4WD dyno for starters. I know some people have forced 2WD, but that’s certainly not indicative of what the car will do on the road.
Many 4WD dynos have locked front and rear rollers (resistance wise), which for a permanent 4WD system (like on a Subaru) that’s all fine. For a Haldex equipped car….. that’s potentially very bad. In basic terms, running a Haldex car on a non-Haldex compatible dyno can result in damaged transmission. You need to use a dyno that is able to adjust resistance as required, between front and rear.
So let’s assume we have that situation covered with the dyno choice made.
The “cell” in which the dyno is located is also very important if you want to maintain accuracy and repeatable results.
Airflow is paramount in achieving both accuracy and a level of safety of your vehicle during dyno use. A dyno is a VERY harsh environment for your car, so you need to ensure that the best environment within the cell is provided. Decent airflow not only helps with replicating (as best as you can) road conditions, but also ensures appropriate airflow assists cooling. A properly constructed dyno “cell” will support these requirements.
There are so many so called “cells” that are effectively in part of the workshop. You’ve seen them. Big open spaces and very high ceilings. Trying to control airflow and pressure in a large space is going to be extremely difficult, if nigh on impossible with the majority of fan and exhaust systems tuners use. The smaller the “space” (cell), the better the environment can be stabilized and controlled, with appropriate fan and exhaust systems shifting huge amounts of air in and out.
Taking all of this into consideration, and based upon my previous experience of using this type of dyno (to appreciate it’s repeatability), I’ll be using the latest MAHA MSR dyno.
An added benefit of the MAHA is that it measures coast down (transmission drag) to derive a flywheel BHP figure (wheel figure + coast down). On a chassis dyno this is the only way to more accurately measure transmission losses. Forget the “fixed %” that is used by so many…. drivetrain losses are not linear. Just think about heat build up (friction/drag) in your drivetrain, which builds as torque is created. The higher the temps, the more friction and greater the losses.
Performance measurement and tuning aids - Racelogic VBOX
We know (well…. I hope we do!) it’s not all about dyno figures, and whilst I’ll be explaining how you should dissect a dyno graph to gain the important information (and that’s NOT going to be about peak figures in isolation), we really need to gauge performance on the “black stuff” surely. Part of this will be completed via road driving feedback, but that can be subjective to a degree. What we really need is another “measure” to compliment ALL the information that is being gathered.
Performance monitoring as regards to recording 0-60, 0-100 & 1/4m times was historically a bit hit and miss as far as the high street consumer has been concerned. Whilst a number of solutions have existed that are very accurate, the costs involved with these solutions had always been out of reach, except for those that require such equipment for official testing and have the budgets to substantiate such equipment.
With the advancements of GPS and the keen pricing of such equipment to the general consumer sector, a new solution appeared on the market a few years ago, that now makes this kind of performance testing, both extremely cost effective and accurate.
RaceLogic have constructed an all-in-one solution that combines a single unit that not only houses all the sensors, GPS receivers and built in screen, but it also gives the ability to log results which can be stored on a memory card and later read and analysed using some very powerful software supplied. All you need is a fag lighter socket (for power) and off you go…… sounds too simple to actually be true and accurate doesn’t it….. well let me assure you it is certainly both simple to use and very accurate. I’ve personally been using these devices for years, attaining “figures” and times which have been referenced against specialist and very expensive timing equipment.
My weapon of choice is the Racelogic Drift Box.
Firstly don’t let the name Drift Box put you off….. this little box of tricks is far more than a box that shows you drift angles!
For the purpose of this project and testing, I suspect we will be concentrating on the uses of the Performance Meter, Lap Timer and Data Logger.
Performance Meter
With the DriftBox it is very easy to measure acceleration times, braking distances, quarter miles times and much more. There are a number of configurable screens that show specific test results such as 0-60, 0-100, 0-100-0, 1/2 miles and ¼ mile etc.
DriftBox is based on the Racelogic VBOX, which is used by the majority of car manufacturers, tyre manufacturers and car magazines around the world to assess performance.
Because it is very easy to edit the test ranges, DriftBox is a very powerful tool for use in many different kinds of vehicle testing.
Lap Timer
Displaying your lap times as you drive around a circuit is simple with DriftBox. You can display your current, last and best lap times, and also display split times for up to six specified split points around the lap.
Through the DriftBox forum you are able to download circuit overlays from around the world, compare lap times, and share lap overlay data with other users.
Data Logger
Every item of data that the DriftBox displays (and loads more besides) is logged and can be recorded on a SD card. This can be read in to a PC at a later date to analyse. The piece of software that comes with the DriftBox to enable this function is very powerful indeed, giving you many different tabular and graphing facilities to display and compare the information captured. The software will even enable you to "play back" captured data sets on screen.
How accurate is it?
Amazingly accurate!!!!!
The lap timing mode proved (based on my testing) to be within .1 seconds accuracy of official track timing equipment.
The performance meter proved (based on my testing) to be within .1 seconds accuracy of several FIA approved drag strips for the 1/4m.
I say all of this I now need to buy a new one as mine appears to give me results that are much slower than real. lol It’s only recently developed this fault…. Being over 10yrs old probably doesn’t help and it’s been dropped a few times. That’s another £500 to fork out then!

Right…. that’s enough “rice” for the entree.
You best visit the toilet for a bowel movement and make some space for the main course (some fitment and testing of tuning products), which will be up for “tasting” shortly!
See you in a couple of days.
