CUSTOM-CODE wrote:Hi Everyone
Firstly thanks for all the interest in our thread .
Ok No Plots or data / vag-com logs until tomorrow.
But we can confirm the STD and C-C Phase1 figures.
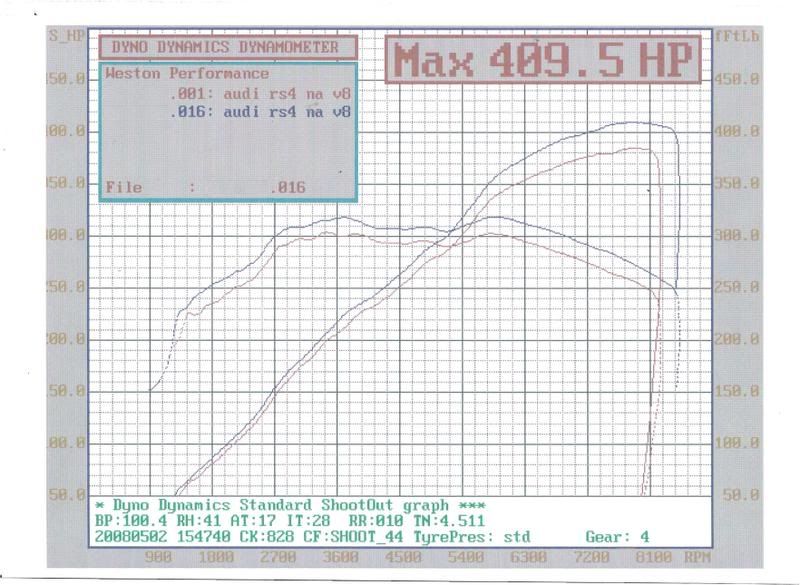
STD = 303 ft-lb and 385 BHP
C-C Phase1 320 ft-lb and 409 bhp.
Some controversial results regarding the STD power but the percentage power increase with C-C Phase1 was as expected. With gains across the whole rev range.
The test car had 10,000mls on it and was totally standard.
More data and plots to follow
Many thanks
CUSTOM-CODE TEAM
CUSTOM-CODE wrote:HiStigter wrote:But the results are calculated as at flywheel from the dyno are they not, taken into account for transmission loss?
Need to know if this is whp or at flywheel.
I am guessing the later as transmission losses will be larger then that for whp for sure.
These perticular figures are @ the flywheel.
Personally i think the dyno was very tight with its numbers , however the percentage increase was pressent.
Cheers
CUSTOM-CODE TEAM
I don't see any way they can be flywheel figures, the transmission losses just don't stack up. Can you confirm please ?